Apologies for the long wait time between this post and the last one. Hopefully we can all relate to the ever-extending nature of holiday/new years lethargy. Anyways, I’m back now!
Last time we left off, I was giving a quick tutorial on Net CDF files using NASA’s sea ice dataset. Today, we’re going to do a quick dip into those chilly waters.
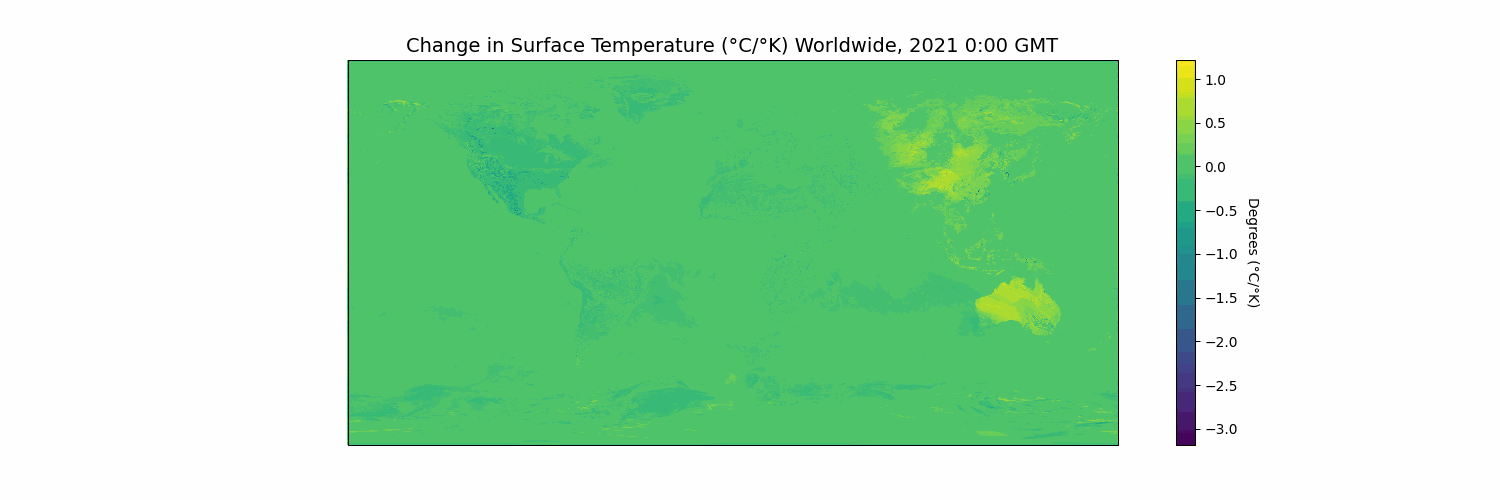
But first look at this fun gif that shows our sun warming up the earth’s surface as the day goes by.
I’ve been using NASA’s online datasets to look at some NetCDF files of sea ice temperature. Naturally, most of the ice is located around the south pole so that is where I focused my maps. Unfortunately, the dataset I used only has two days worth of data… not too much but interesting to look at nonetheless.
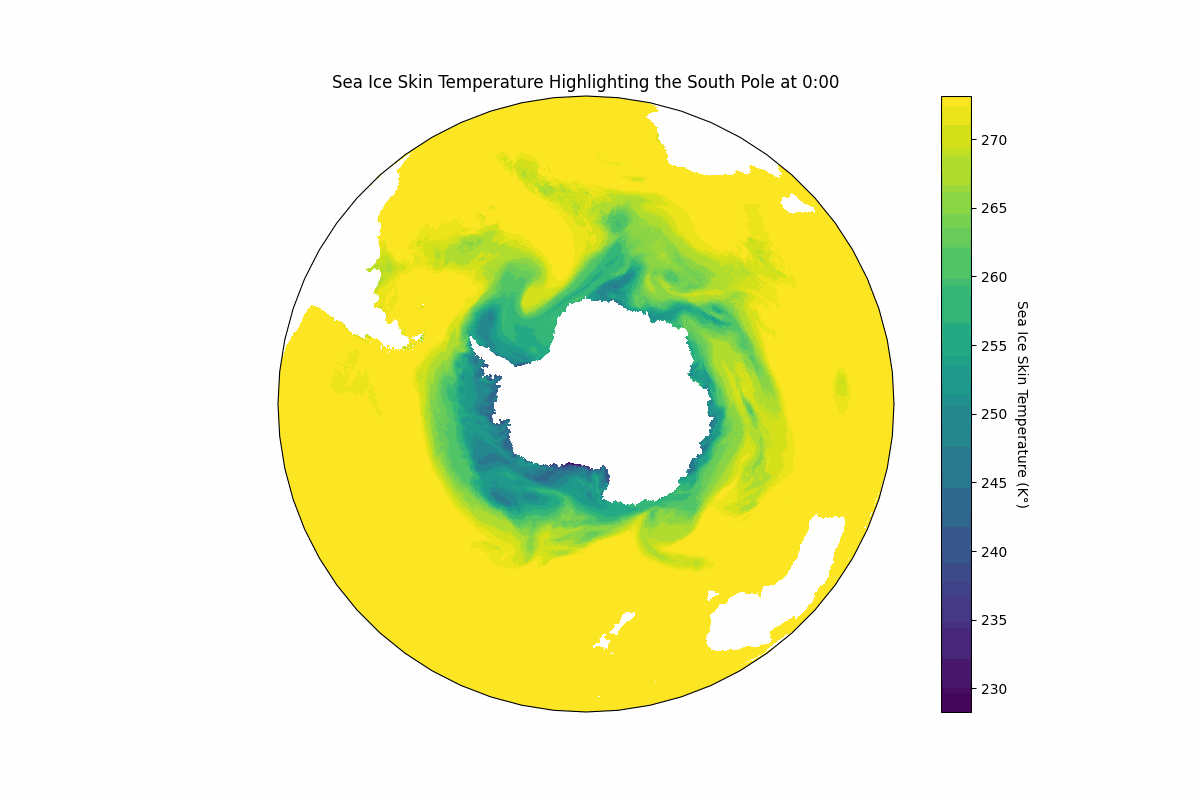
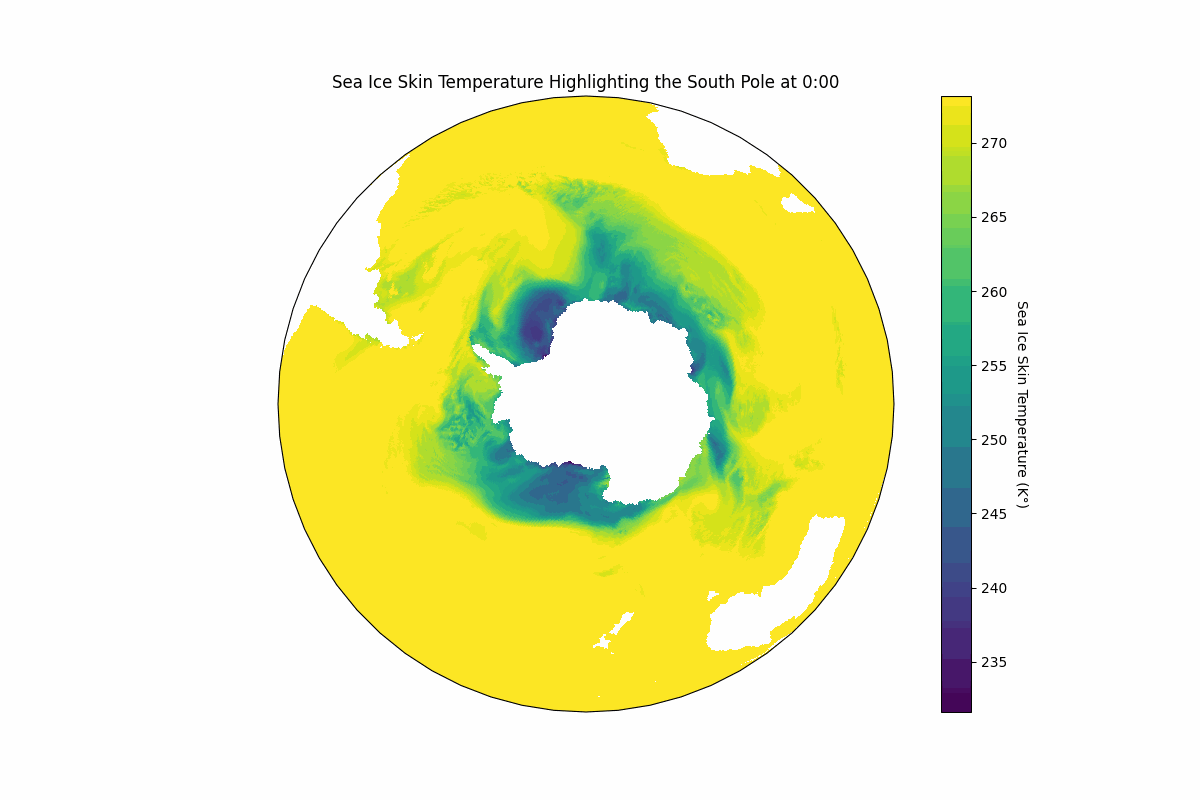
I thought this was quite pretty, but what info can we get out of it? Well… not that much. We don’t have enough data to be able to create any sort of predictive models, nor can we get a glimpse into how it’s changed over the course of many decades. Pretty much the only thing I think we can get out of it is looking at how ocean currents move water over the course of a day.
As a result of this lack of data I decided to alter course for this post and focus it on general information about our oceans, sea ice, and why all of it is important.
I ended up finding another much simpler dataset that tracked the sea ice extent from 1979 until 2019. Extent is an interesting metric that looks at the amount of area that has at least 15% sea ice. The reason for this method of measurement has to do with the microwave sensors they use to get the data. Microwave sensors are great because they help us see through clouds, or in the dark (at least the dark to us). But they come at the cost of not having great visual acuity. Thus scientists made a new metric called sea ice extent which can still help us gather information on the fluctuations in the global sea ice.

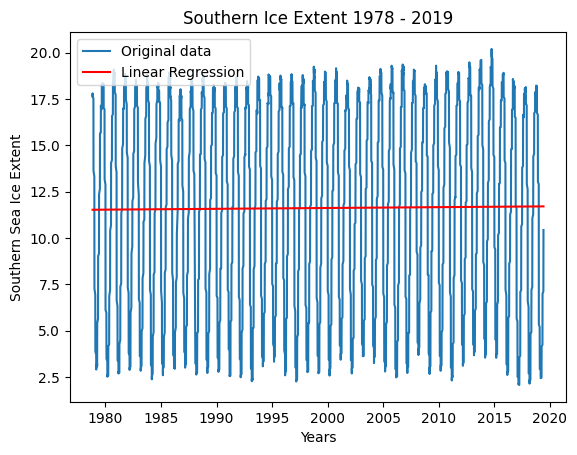
What’s clear to see in the figure 3 is that the arctic ice extent is undoubtedly shrinking. But what I found quite curious was that the southern (antarctic) ice extent didn’t seem to be changing much and actually, the trend is an incredible tiny increase.
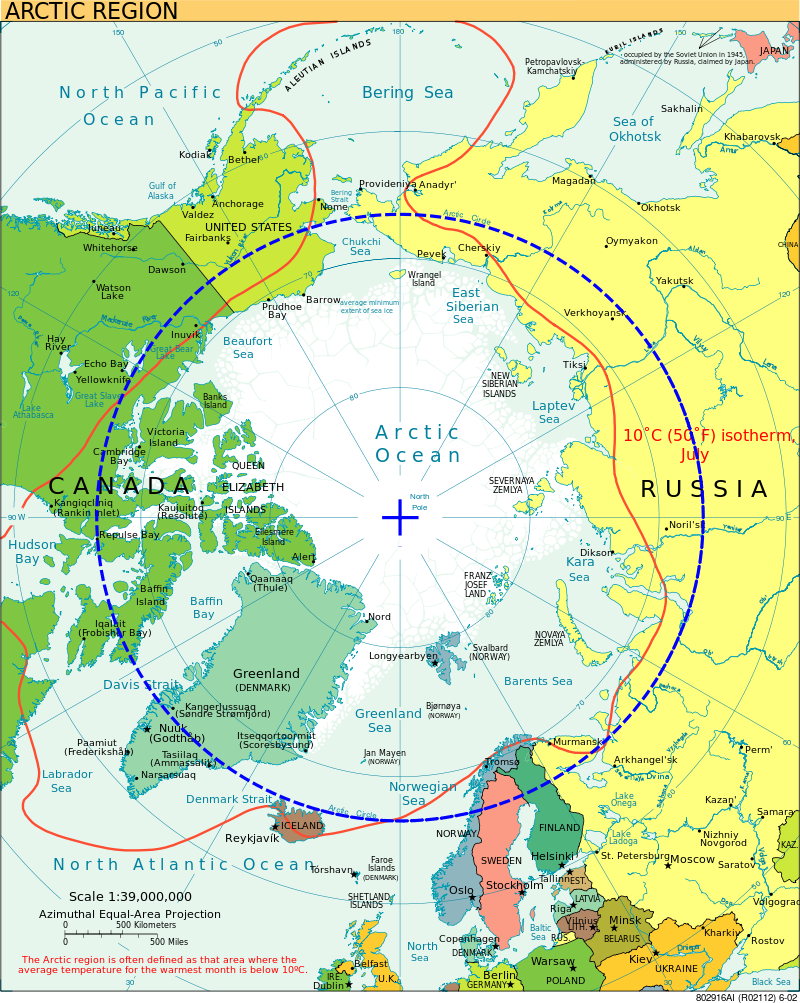
The reason for these differences is because of the way ice is formed in Antarctica and the Arctic. Antarctica is a continental land mass whereas the Arctic is simply a polar region (fig. 5) that consists of the Arctic Ocean, some surrounding seas like Barents Sea, Greenland Sea, East Siberian Sea etc. This means that it responds in a more dramatically to fluctuations in ocean temperatures1. Since we are in the midst of major global warming the arctic sea ice responds in kind.
The presence of sea ice is also a protection against global warming because the ice acts as a reflective surface that bounces solar radiation off of. However, as we continue to see less and less arctic ice, we will see an acceleration in global warming, and climate change.
Unfortunately, this is all I have for now, but I am definitely going to do a follow up to these ideas. But I was keen on getting back onto the posting grind and I will be back with more stuff soon!
Resources
Data:
https://www.kaggle.com/datasets/brsdincer/ocean-data-climate-change-nasa/data
Leave a Reply